Team Dashboards
Dashboards provide customizable analytics views for your team, helping you track performance, monitor progress, and make data-driven decisions.
Dashboards provide customizable analytics views for your team, helping you track performance, monitor progress, and make data-driven decisions.
Accessing Dashboards
- Ensure you're in your team account
- Click Dashboard in the sidebar
- The URL is
/home/[team]/dashboards
Dashboard Overview
What is a Dashboard?
A dashboard is a collection of widgets that display data visualizations:
- Metric Cards - Single aggregated numbers
- KPI Cards - Metrics with target comparison
- Charts - Bar, line, area, pie, and doughnut charts
- Data Tables - Rows of records
- Link Widgets - Navigation tiles
Dashboard Visibility
Dashboards can be:
- Private - Only you can see them
- Shared - Team members with permissions can view or edit
Dashboard List
The dashboard list page shows all dashboards you have access to:
| Information | Description |
|---|---|
| Name | Dashboard title |
| Widget Count | Number of widgets |
| Created | When was the dashboard created |
| Sharing Status | Private (lock icon) or shared (user icon) |
Creating a Dashboard
New Dashboard
- Click Create Dashboard
- Enter a dashboard name
- Optionally add a description
- Choose privacy setting (private or shared)
- Click Create
New dashboards start empty and require adding widgets.
Adding Widgets
Widget Wizard
- Click Add Widget on your dashboard
- The widget wizard opens with these steps (may vary depending on diagram type):
Step 1: Widget Info
- Enter widget name and description
- Select widget type
Step 2: Data Source
- Choose which data to visualize
Step 3: Configuration
- Configure metrics and dimensions
- Set filters and time ranges
- Define sorting and limits
- Set number formatting
- Configure targets (for KPI cards)
- Set up links (for link widgets)
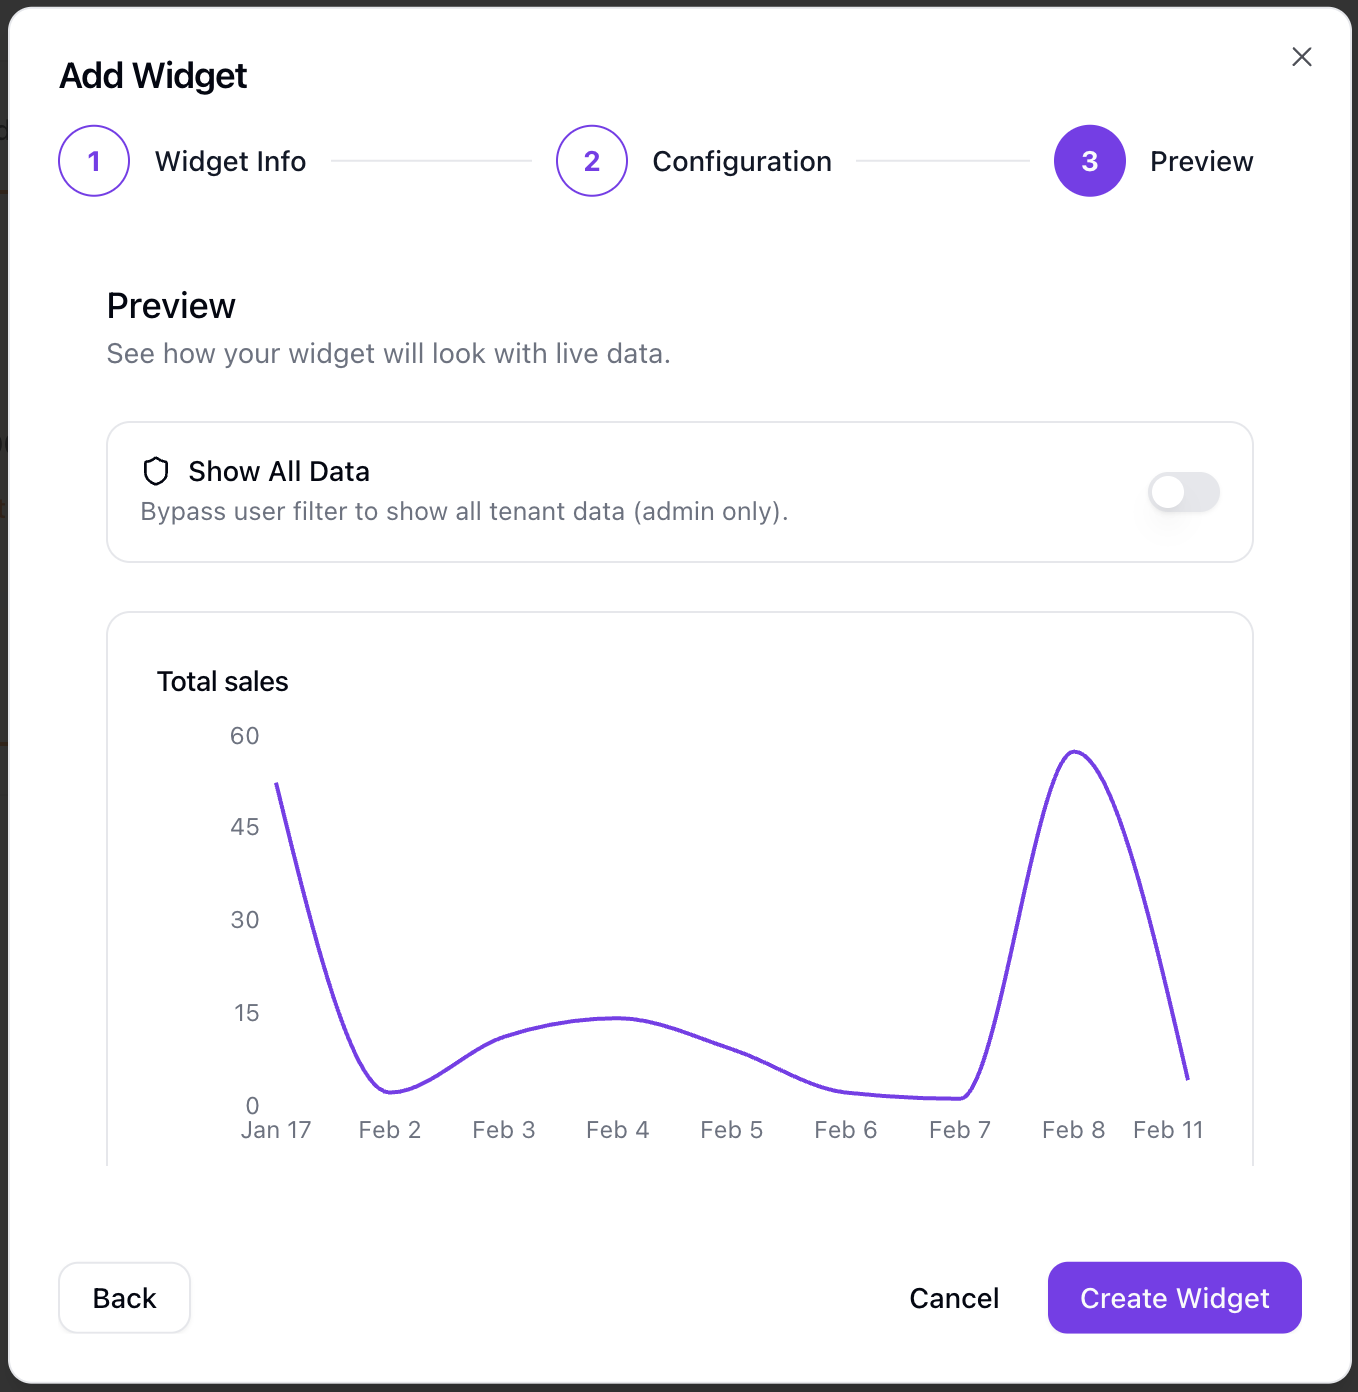
Step 4: Preview
- Review your widget before saving
Widget Types
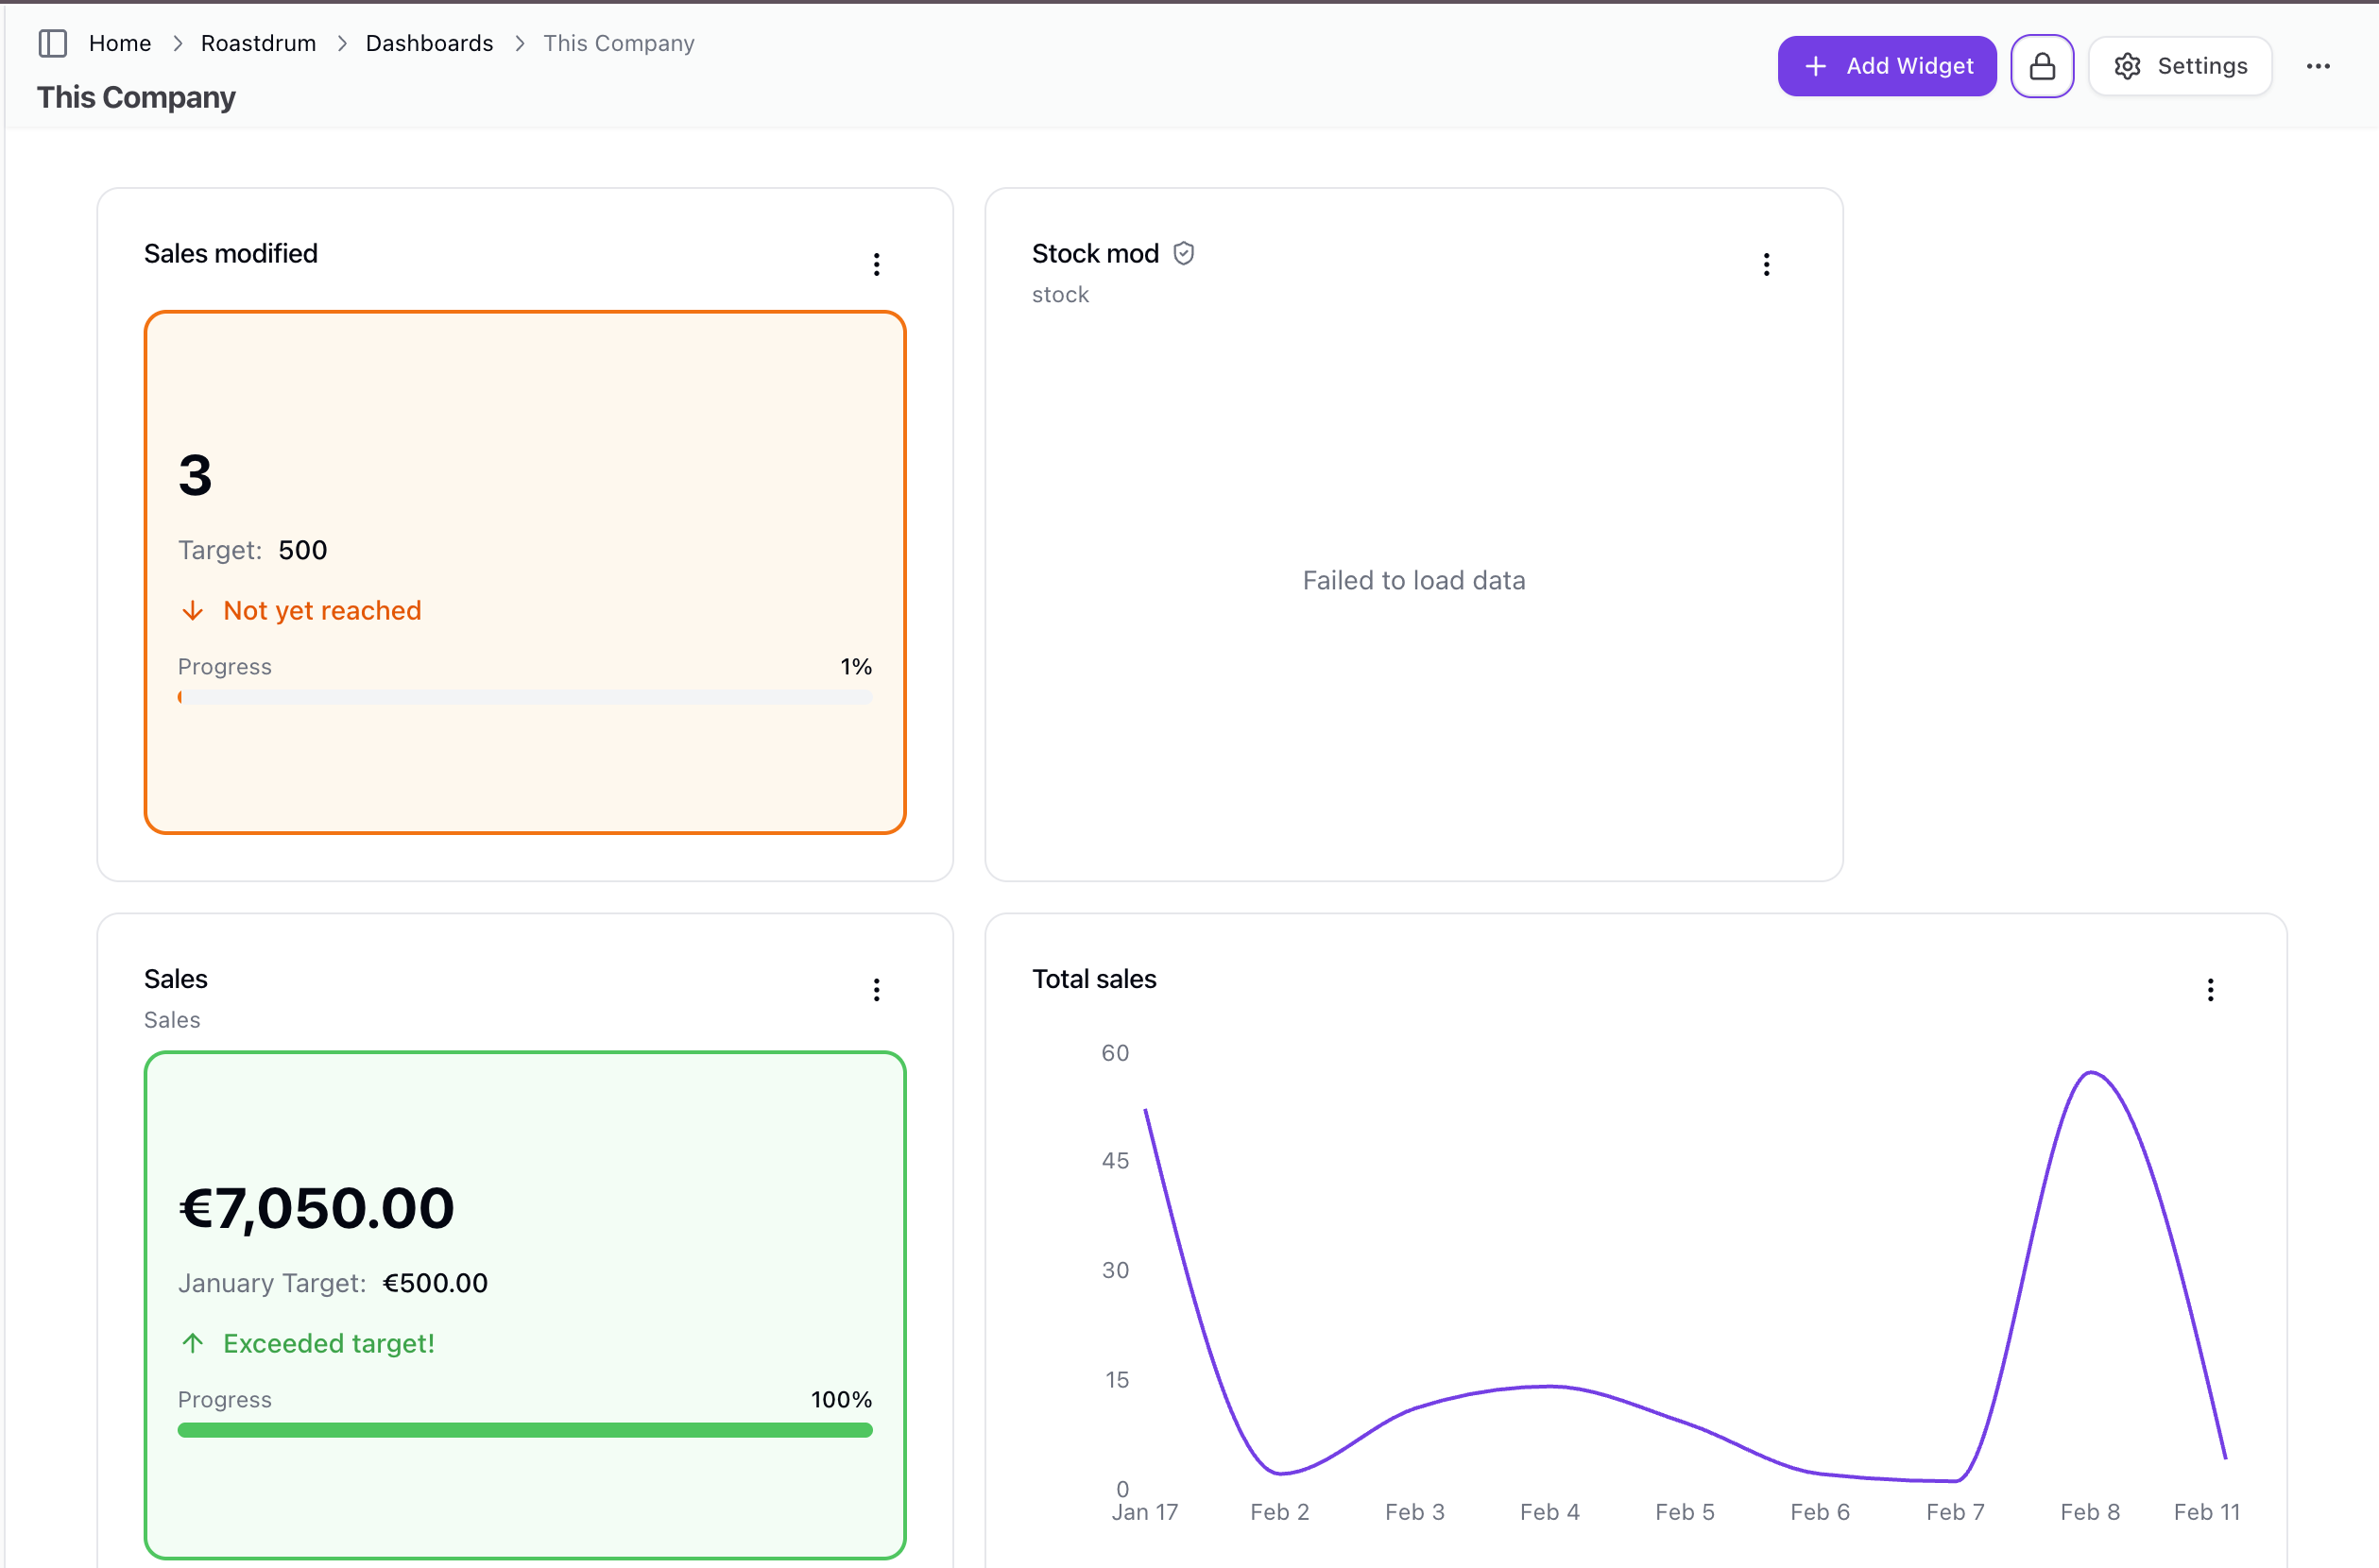
Metric Card
Displays a single aggregated number:
- Total sales this month
- Number of addresses
- Average order value
KPI Card
Metric with performance tracking:
- Shows current value vs target
- Performance indicator
- Comparison to goal
Bar Chart
Compare values across categories:
- Sales by product
- Addresses by state
- Revenue by team member
Line Chart
Show trends over time:
- Daily sales trend
- Weekly activity
- Monthly commission
Area Chart
Time series with filled areas:
- Cumulative sales
- Progress tracking
Pie/Doughnut Chart
Show proportions:
- Sales distribution by product
- Addresses by status
Data Table
Display records in rows:
- Recent sales list
- Top performers
- Activity log
Link Widget
Navigation tiles:
- Quick links to other dashboards
- External URLs
Available Data Sources
Widgets can visualize data from:
| Data Source | Description |
|---|---|
| Sales | Revenue, status, products, salesperson |
| Commissions | Commission amounts and dates |
| Interactions | Customer/contact interactions |
| Addresses | Location and status data |
| Projects | Project tracking |
| Zones | Geographic zone data |
| Bonus Targets | Goal tracking |
| Products | Product catalog |
| Promotions | Promotional campaigns |
| Inventory Movements | Stock tracking |
Widget Templates
Use pre-built templates for quick setup:
- Templates appear in a template gallery
- One-click to add common widgets
- Customize after creation
Customizing Dashboards
Layout Editing
Dashboards use a grid-based layout:
- Drag & drop widgets to reposition
- Resize widgets by dragging corners
- Layout changes auto-save
Widget Options
For each widget you can:
- Edit - Modify configuration
- Delete - Remove from dashboard
Auto-Refresh
Widget data automatically refreshes every 60 seconds to keep information current.
Dashboard Settings
Accessing Settings
- Open your dashboard
- Click the Settings button in the toolbar
- Or click Settings from the dashboard list
Available Settings
| Setting | Description |
|---|---|
| Name | Dashboard title |
| Description | Purpose of the dashboard |
| Privacy | Private or shared |
Deleting a Dashboard
- Go to dashboard settings
- Click Delete Dashboard
- Confirm deletion
Warning: Deleting a dashboard removes all its widgets and cannot be undone.
Dashboard Permissions
Permission Levels
| Level | Capabilities |
|---|---|
| View | See widget data (read-only) |
| Edit | Add, modify, and delete widgets |
Managing Permissions
Dashboard creators can manage who has access:
- Open dashboard settings
- Navigate to permissions section
- Add users or roles with specific permission levels
- Remove access as needed
Assigning Permissions
Permissions can be assigned to:
- Specific users - Grant access to individual team members
- Roles - Grant access to everyone with a specific role (e.g., all managers)
Default Dashboard
Setting a Default
Set a dashboard as your default landing page:
- From the dashboard list, click the menu on a dashboard
- Select Set as Default
- This dashboard opens when you visit the dashboards page
Your Default is Yours
Each user can have their own default dashboard. This setting is personal and doesn't affect other team members.
Audit History
Team owners can view the change history for dashboards:
- Click the menu on a dashboard
- Select View Audit History
- See who made changes and when
This includes changes to dashboard settings and widgets.
Best Practices
Dashboard Design
- Keep it focused - One purpose per dashboard
- Prioritize key metrics - Most important at the top-left
- Use appropriate widgets - Match visualization to data type
- Don't overcrowd - Leave white space for readability
Widget Selection
| Use Case | Recommended Widget |
|---|---|
| Single key number | Metric Card |
| Progress toward goal | KPI Card |
| Compare categories | Bar Chart |
| Trends over time | Line Chart |
| Show proportions | Pie/Doughnut Chart |
| Detailed records | Data Table |
Permission Management
- Start private - Create dashboards privately first
- Share when ready - Make shared after configuration is complete
- Use roles - Assign permissions to roles for easier management
- Review periodically - Audit who has access to sensitive dashboards
Troubleshooting
Widget Shows No Data
- Verify filter settings aren't too restrictive
- Check the time range configuration
- Ensure data exists for the selected criteria
- Try editing and re-saving the widget
Permission Issues
If you can't view or edit a dashboard:
- Verify you have the appropriate permission level
- Contact the dashboard creator to request access
- Check if you're in the correct team account
Performance Issues
If dashboards are slow:
- Reduce the number of widgets
- Narrow time ranges
- Use simpler aggregations
Exporting as PDF
You can export any team dashboard as a multi-page PDF document to share a snapshot of your analytics without requiring access to Sellfaster.
How to export
- Open the dashboard you want to export
- Click the Export PDF button in the dashboard toolbar
- Sellfaster captures all visible widgets at 2× resolution and composes them into an A4 PDF
- The file downloads automatically to your browser's default download location
The export includes every widget currently visible on the dashboard. Widgets are rendered at high resolution and assembled into pages.
Related Topics
- Bonus Targets - Goal tracking
- Sales - Sales data
- Commission - Earnings tracking
- Projects Overview - Project data