How to Use Map View
This guide covers how to effectively use the map view to visualize leads and work with territories.
This guide covers how to effectively use the map view to visualize leads and work with territories.
Map Technology
Sellfaster uses MapLibre GL with OpenFreemap tiles to display leads geographically. The map provides:
- Interactive pan and zoom
- Lead markers with state indicators
- Zone overlays
- Clustering for large datasets
Accessing Map View
Campaign Map
- Navigate to a campaign
- Go to
/home/[team]/projects/[campaign]/map - View all campaign leads on the map
Personal Leads Map
- Navigate to
/home - Find the map view for your personal leads across all campaigns
Basic Navigation
Panning
Move around the map:
| Action | How |
|---|---|
| Mouse drag | Click and drag to pan |
| Touch | Swipe on mobile |
Zooming
Adjust the view:
| Action | How |
|---|---|
| Scroll wheel | Scroll up/down to zoom |
| Zoom buttons | Click +/- controls |
| Double-click | Double-click to zoom in |
| Pinch | Pinch gesture on mobile |
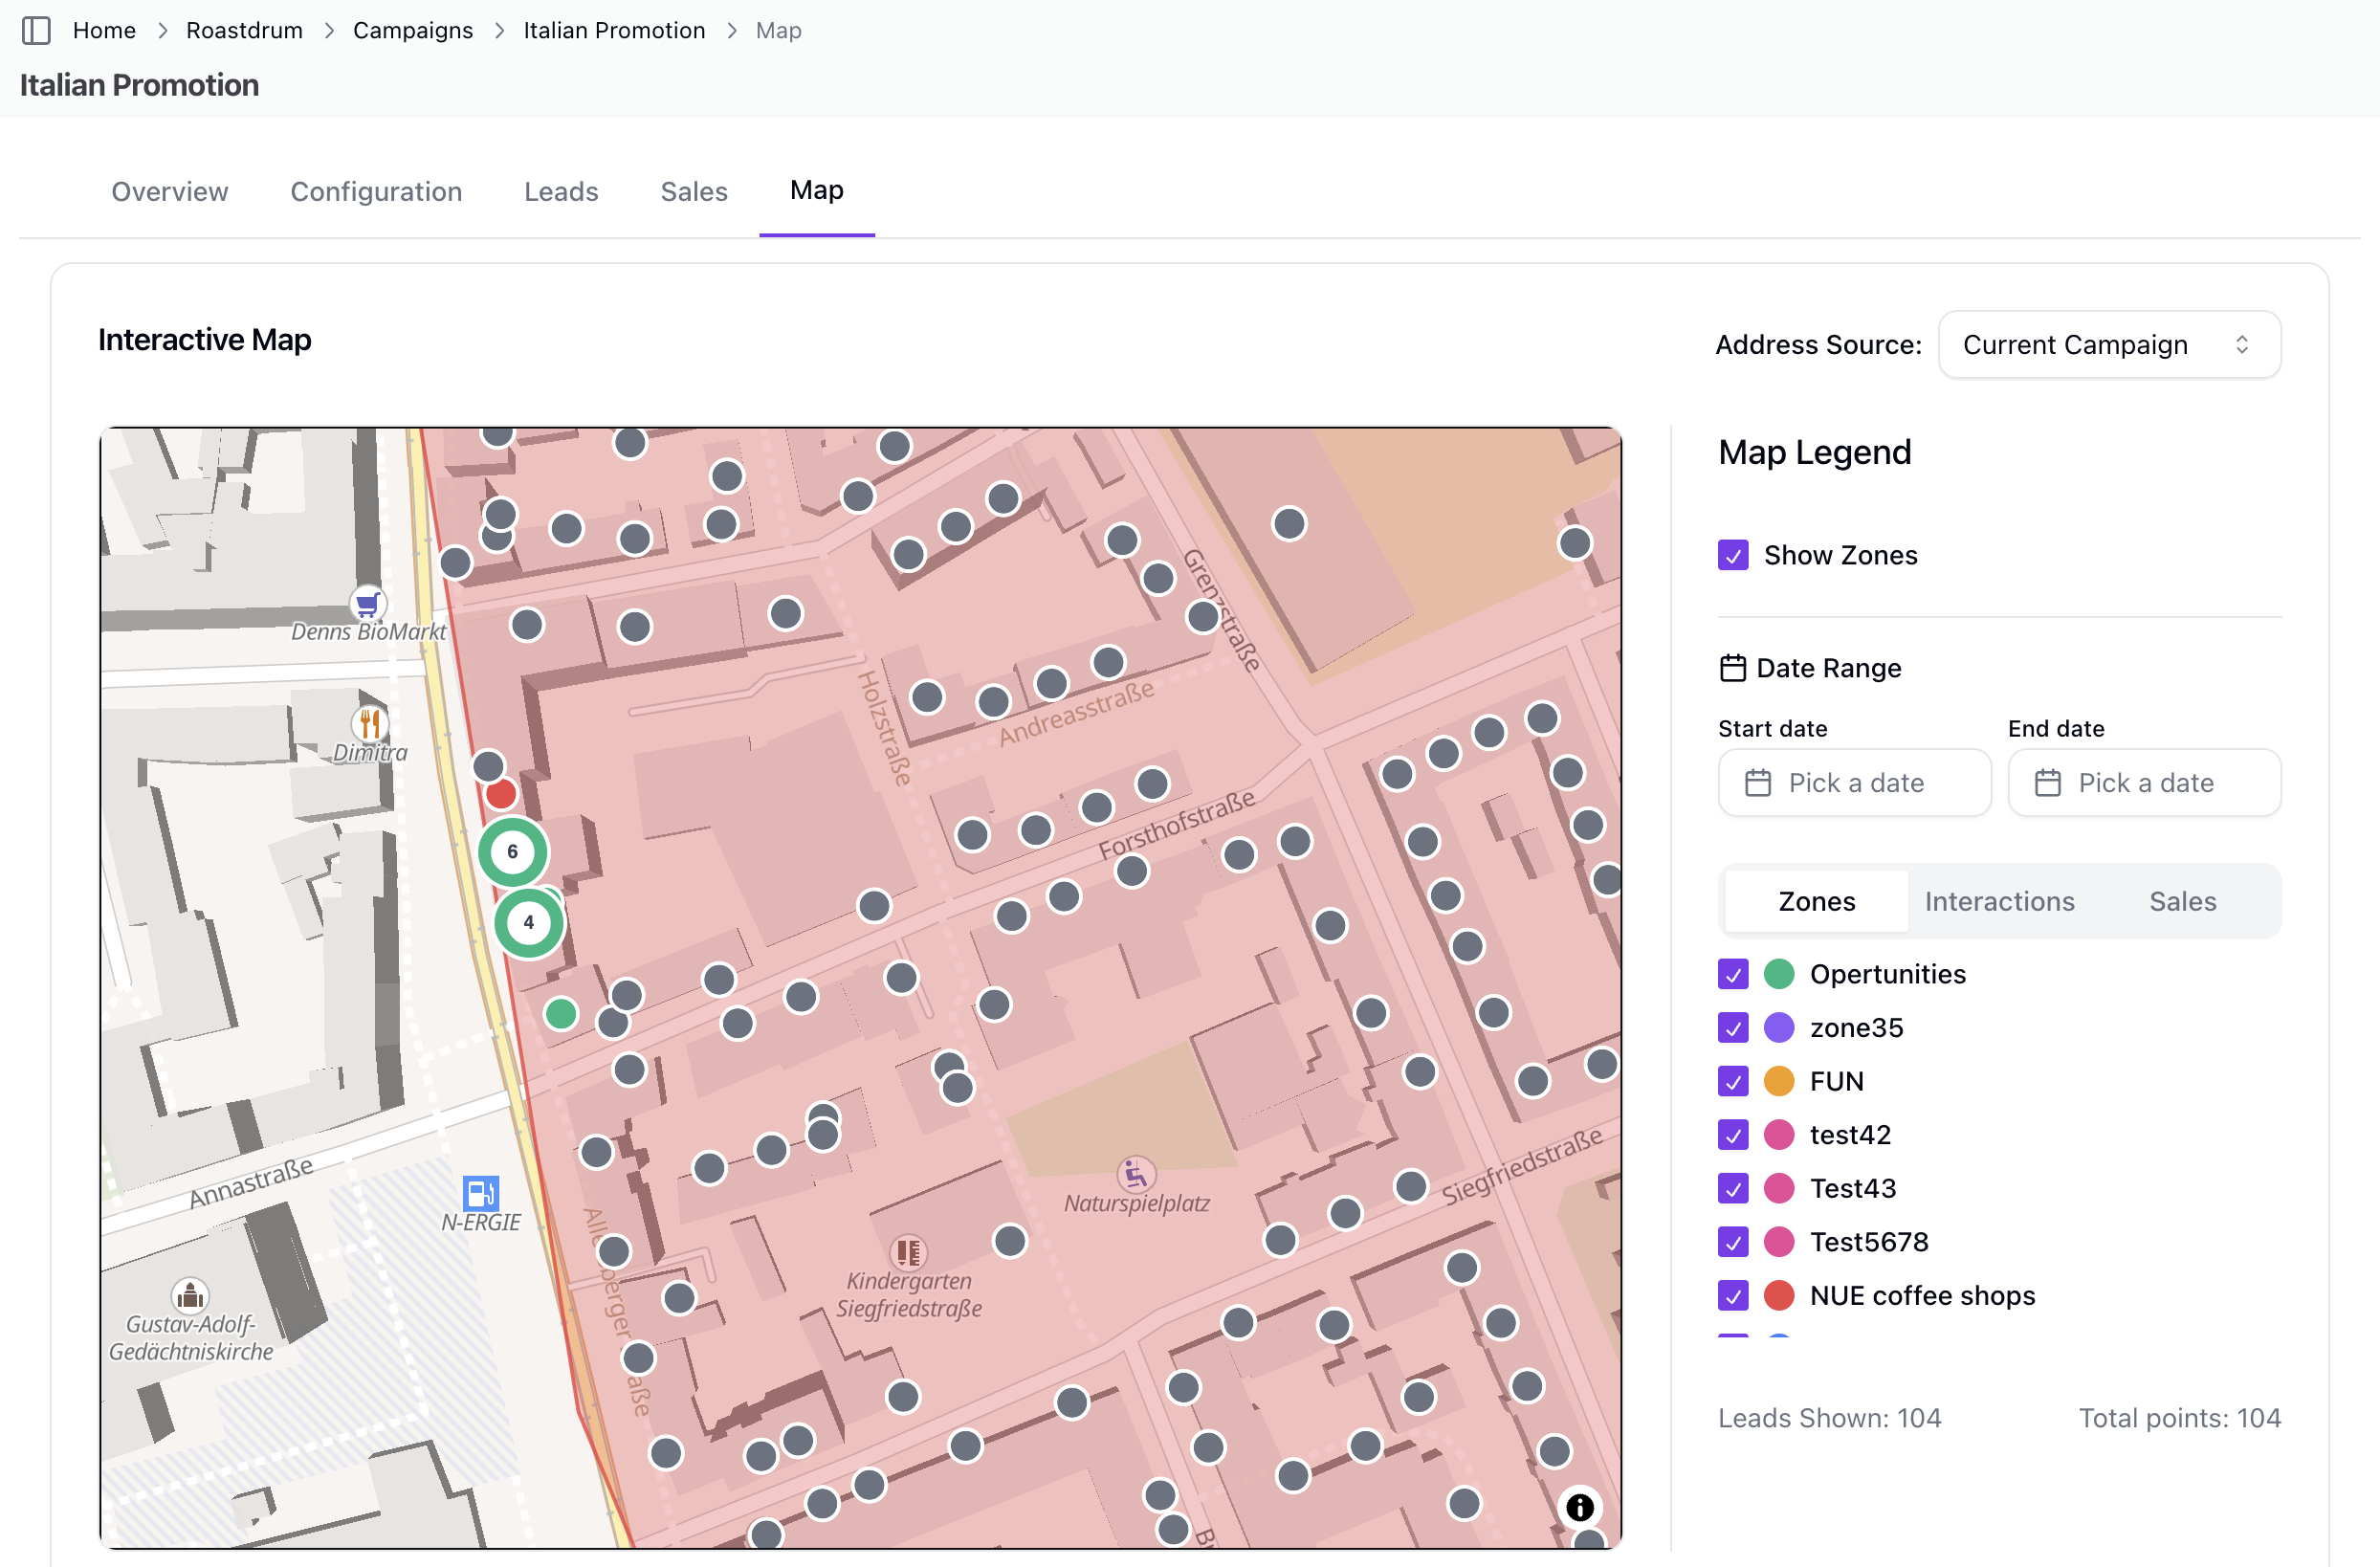
Understanding Markers
Marker Colors
Markers are color-coded based on interaction state:
| Color | State |
|---|---|
| Red (#ef4444) | Closed - lead has keep_open: false |
| Yellow (#eab308) | Appointment Pending - has follow_up: true |
| Green (#22c55e) | Open - has keep_open: true |
| Gray (#6b7280) | No Interaction recorded |
Apartment Building Markers
Buildings with multiple units display differently:
- Donut chart visualization showing unit distribution
- Segments show: Sold, Closed, Follow-up, Other units
- Unit count displayed in center
- Click to see full unit breakdown
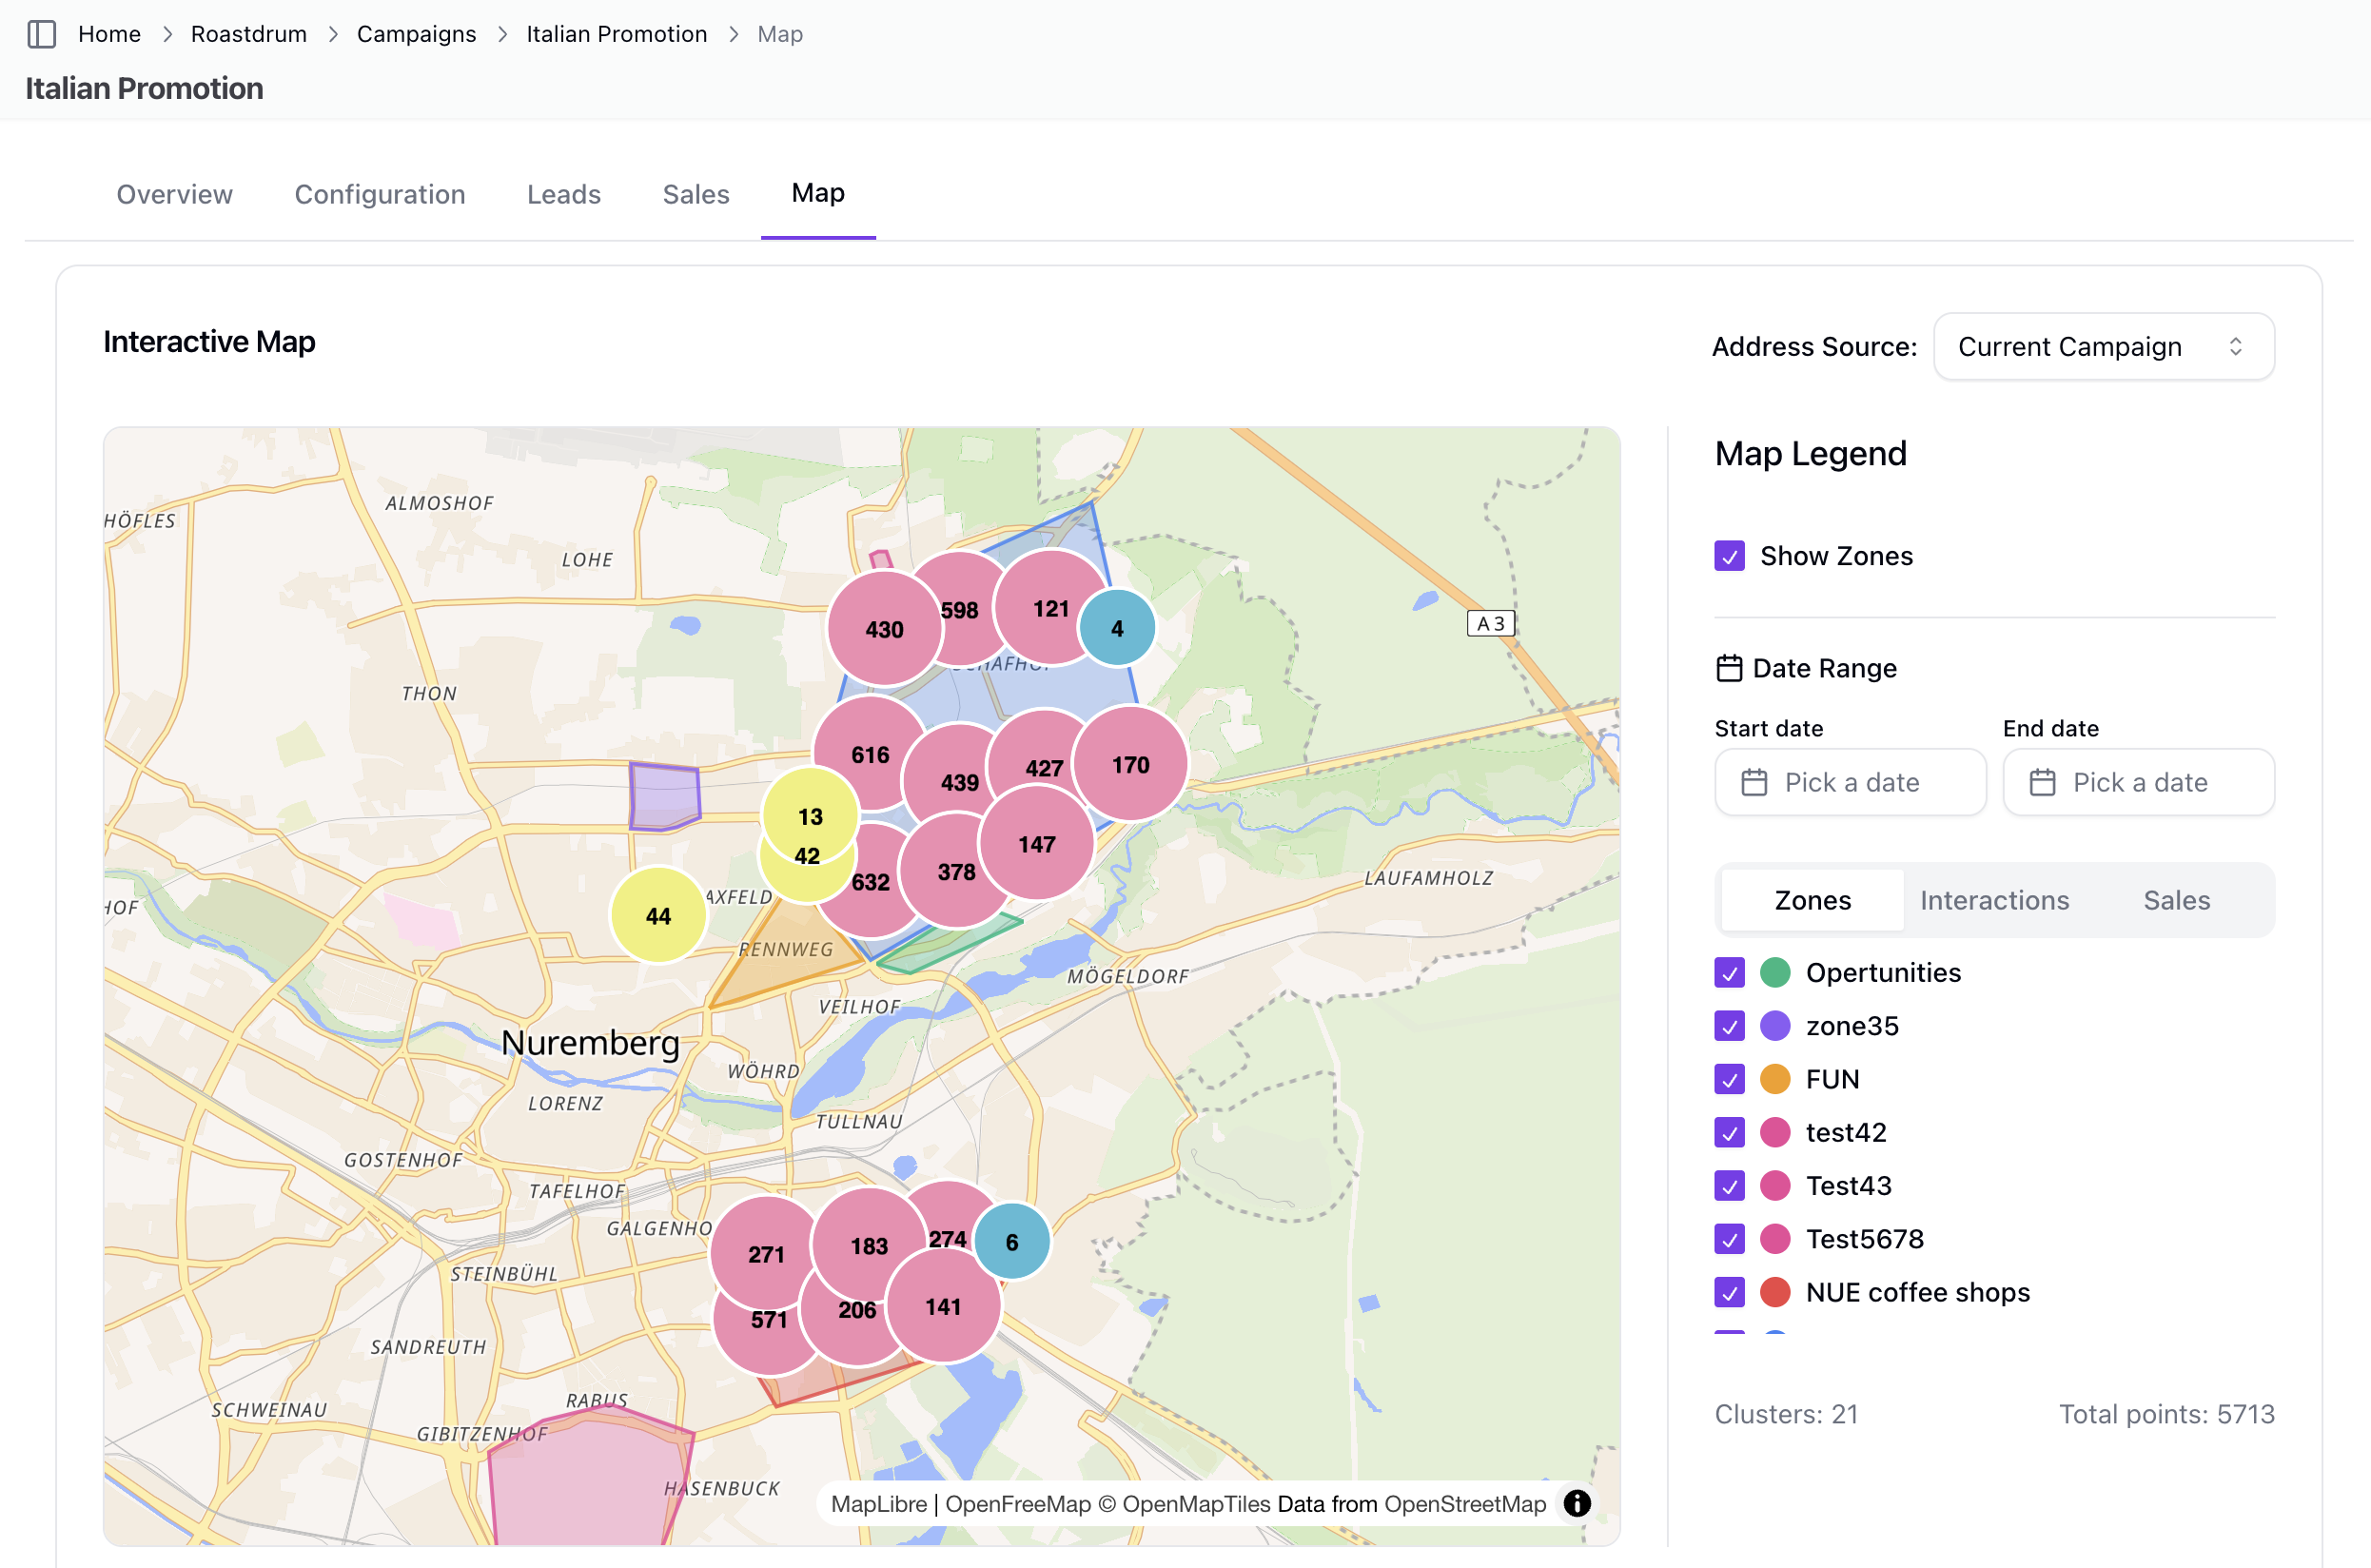
Marker Clustering
When zoomed out or viewing many leads:
- Nearby markers cluster together
- Cluster shows total count
- Click cluster to zoom in (zoom +2 levels)
- Cluster colors indicate density:
- Blue: < 10 points
- Yellow: 10-100 points
- Pink: > 100 points
- Clustering enables automatically when 50+ leads visible
- Clusters appear at zoom levels < 15
Interacting with Leads
Viewing Lead Info
Click a marker to see a popup with:
- Street lead
- Campaign name
- Zone name (with "Auto-assigned" badge if applicable)
- Unit breakdown for buildings
- Interaction state badge
- "View Details" button
Hover Behavior
- Hovering on markers shows tooltip
- Hovering on zone boundaries highlights them
- Zone opacity increases to 0.5 on hover
Navigation
Click "View Details" to go to the full lead page at: /home/[account]/projects/[campaign]/addresses/[lead]
Filtering the Map
Filter Panel
The campaign map includes a filter panel with tabs:
- Zone Filter - Show/hide specific zones
- Interaction Filter - Filter by interaction state
- Sales Filter - Filter by product and sale state
Available Filters
| Filter | Description |
|---|---|
| Zone | Checkbox selection of multiple zones |
| Interaction State | Filter by configured states |
| Product | Filter sales by product |
| Sale State | Filter by sale state |
| Date Range | Start and end date pickers |
Visibility Toggles
Toggle display of:
- Zones (show/hide zone overlays)
- Interactions (filter interaction markers)
- Sales (filter sale markers)
Lead Source
Switch between:
- Campaign leads only
- All account leads
Working with Zones
Viewing Zones
Zones display as colored polygon overlays:
- Each zone has a distinct fill color
- Zone boundaries show on hover with increased opacity
- Zone outlines are 2px (3px on hover)
Zone Information
Click a zone to see:
- Zone name
- Zone color
- Lead count within zone
Zone Display
Zones are rendered as GeoJSON features supporting:
- Polygon shapes
- MultiPolygon shapes
Viewport-Based Loading
The map uses intelligent loading for performance:
- Leads load based on visible map bounds
- 500ms debounce prevents excessive loading
- Data merges as you pan (doesn't reload everything)
- Activity indicators show leads with interactions/sales
Map Legend
The legend shows:
- Marker color meanings (Closed, Appointment, Open, No Interaction)
- Apartment building indicator
- Can be toggled on/off
Map Statistics
The map displays:
- Total leads shown
- Clusters shown (when clustering enabled)
- Total data points
Tips for Effective Map Use
Visual Planning
- Color scanning - Quickly identify states by color
- Cluster awareness - Zoom into dense areas for detail
- Zone organization - Work within assigned zones
- Filter usage - Show only relevant leads
Performance
For better performance:
- Use filters to reduce visible leads
- Zoom into your working area
- Filter by zone to limit data
- Clustering helps with large datasets
Daily Workflow
- Morning review - View your territory
- Identify targets - Find leads by state/color
- Work by area - Focus on one zone at a time
- Track progress - Watch colors change as you work
Troubleshooting
Leads Not Showing
If markers don't appear:
- Check active filters
- Zoom out to see all markers
- Verify leads have coordinates (latitude/longitude)
- Refresh the page
Map Not Loading
If map won't load:
- Check internet connection
- Clear browser cache
- The map has retry logic (up to 10 attempts)
- Try a different browser
Wrong Location
If leads are misplaced:
- Check the original lead entry
- Lead may need geocoding correction
- Verify coordinates are accurate
Slow Performance
If map is slow:
- Apply filters to reduce visible leads
- Zoom into a smaller area
- Clustering should enable automatically
- Close other browser tabs
Technical Details
Map Configuration
- Tile provider: OpenFreemap (Liberty style)
- Library: MapLibre GL via react-map-gl
- Data format: GeoJSON for zones and clustering
- Clustering threshold: 50+ leads
- Cluster zoom threshold: < zoom level 15
Viewport Loading
- Debounce: 500ms on viewport changes
- Data merging: Preserves existing data when panning
- Cleanup: Proper unmount handling
Related Topics
- Map View - Campaign map features
- Recording Interactions - From lead detail
- Campaign Leads - Lead management